特徵选择/范例七: Comparison of F-test and mutual information
这个范例是解释单变量选择特徵的两个方法,F-test statistics以及mutual information。单变量特徵选择可以算是选择特徵的预处理,用以判断适当的特徵选择方式。
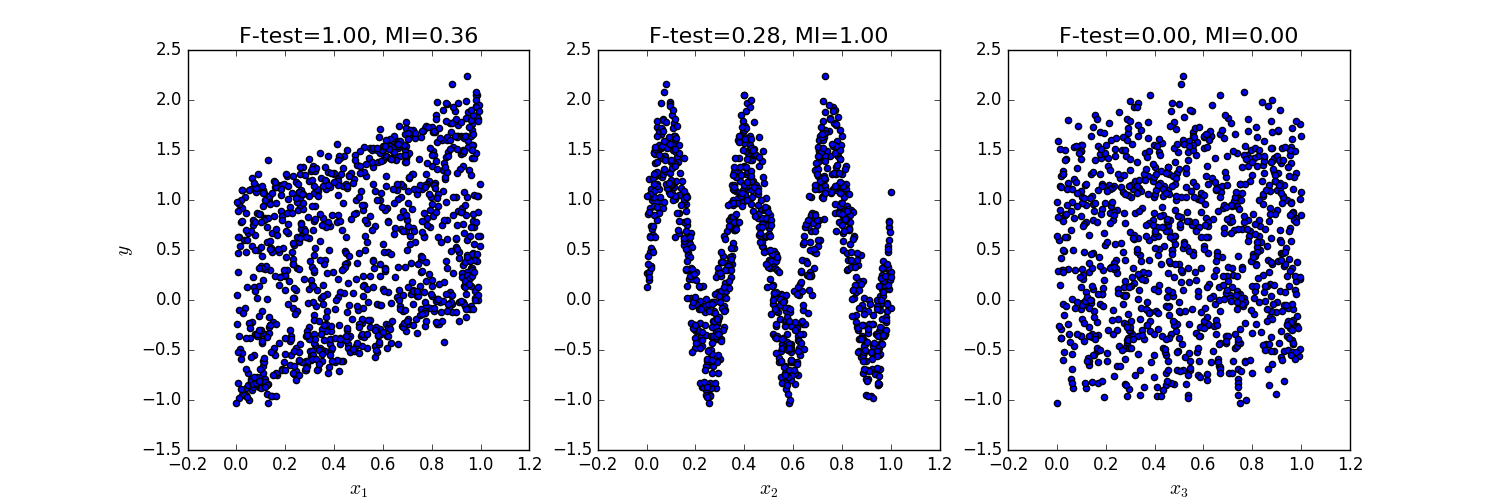
此范例假设了三个特徵变数x1, x2, x3分布在0与1之间,并且依照下列公式模拟预测目标: y = x1+ +sin(6 pi x2)+0.1 * N(0,1) 第三个特徵变量与预测目标无相关
下面的函式画出了y与每个x_i之间的相依性,并且把F-test statistics以及mutual information的计算分数算出来,可以看到不同的变数影响方式在两种方法会有不同的结果。
F-test 的结果只会关注线性相关的变数影响,该方法选择x1作为最具有特徵影响力的变量。另一方面,mutual information方法可以选出经过不同函式呈现的目标变数特徵,而他选择了X2作为最具有影响力的特徵,我们在直觉上认为能找出经过三角函数转换过的特徵变数,更符合在这个例子中目标变数的影响方式。而两种方法都准确的判断x3与目标变数无相关性。

import numpy as np
import matplotlib.pyplot as plt
from sklearn.feature_selection import f_regression, mutual_info_regression

np.random.seed(0)
X = np.random.rand(1000, 3)
y = X[:, 0] + np.sin(6 * np.pi * X[:, 1]) + 0.1 * np.random.randn(1000)

f_test, _ = f_regression(X, y)
f_test /= np.max(f_test)

mi = mutual_info_regression(X, y)
mi /= np.max(mi)

plt.figure(figsize=(15, 5))
for i in range(3):
    plt.subplot(1, 3, i + 1)
    plt.scatter(X[:, i], y)
    plt.xlabel("$x_{}$".format(i + 1), fontsize=14)
    if i == 0:
        plt.ylabel("$y$", fontsize=14)
    plt.title("F-test={:.2f}, MI={:.2f}".format(f_test[i], mi[i]),
              fontsize=16)
plt.show()